MantisNMS · Getting Started Guide
MantisNMS Getting Started
This guide covers everything you need to get MantisNMS running — from installing your first probe to discovering devices, mapping your network, adding SNMP and uptime sensors, choosing which switch interfaces to monitor, host sensors, alerting, syslog/trap collection, flow monitoring and the Network overview. Follow the steps in order if you're new, or jump to any section via the sidebar.
Overview
MantisNMS is a cloud-delivered network monitoring platform. The management portal is at nms.mantisops.net — there is no server software to install. The only on-premises component is a lightweight probe that runs on any host inside your network and reaches your devices via SNMP and other protocols. The probe is the same signed Go binary as the Mantis360 probe, so a single deployment can serve both products.
Core concepts
| Concept | Description |
|---|---|
| Probe | Software you install on a host inside a network segment. It polls devices, receives syslog/traps and flow exports, and posts results to the cloud. |
| Device | A monitored piece of infrastructure — a switch, router, firewall, server, printer, UPS, etc. A device is a free container; its sensors are what you monitor. |
| Sensor | A single monitored element: an SNMP device interface, a host aspect (CPU / memory / disk / uptime), or a leaf check (ping, HTTP, TCP, SSH). |
| Interface sensor | One switch/router port you have chosen to monitor — bandwidth in/out and up/down availability. |
| Host sensor | A resource on a monitored device: System Uptime, CPU Load, Memory, or one per fixed disk. |
| Incident | An open event raised when a sensor goes down (device unreachable, interface down, threshold breached) and closed when it recovers. |
Finding Your Way Around
MantisNMS opens on Overview, the Network overview. The labelled sidebar on the left groups every page under Monitor (Overview, Dashboard, Devices, Maps, Flows, Config backups, Discovery), Respond (Alerts, Events, Rules) and Manage (Probes, Reports, Tools, Settings). Collapse sidebar shrinks it to a rail of icons; on a phone the sidebar opens as a drawer from the menu button.
- Product and client switchers — at the top of the sidebar. Jump between MantisRMM, Mantis360, MantisNMS and the Customer Portal, and choose All companies, one company, or one of its sites. Every page follows the client you pick.
- Search — press Ctrl K (⌘K on a Mac) or click Search or jump to… to find devices, sensors, probes, companies and pages, or to run an action such as Add a sensor or Discover devices.
- Top bar — the breadcrumb shows where you are. Status chips count sensors that are down, in warning, or waiting for credentials (cred required); click one to open Devices. All up means nothing needs you. The probe picker sets the preferred probe for tools and discovery; Auto picks the best probe for the selected company or site.
- Billable sensors — the meter near the bottom of the sidebar shows your usage against your plan. Click it for the breakdown (see How Sensors Are Counted).
- Your menu — click your account at the bottom of the sidebar for Theme (Dark or Light), Rows (Comfortable or Compact), Copy tenant ID, Settings and Sign out. MantisNMS starts in the dark theme; once you choose one, your choice is kept.
Install the Probe
The probe runs on any always-on host inside the network you want to monitor — a small VM, a spare server, or an existing Mantis360 probe host. It communicates outbound over HTTPS/WSS; no inbound firewall changes are required for polling.
Download the probe
Copy the install command from the Customer Portal → Agents & Probes → Network Probe, or in MantisNMS from Manage → Probes → + Install a probe. The command already contains your probe enrollment code.
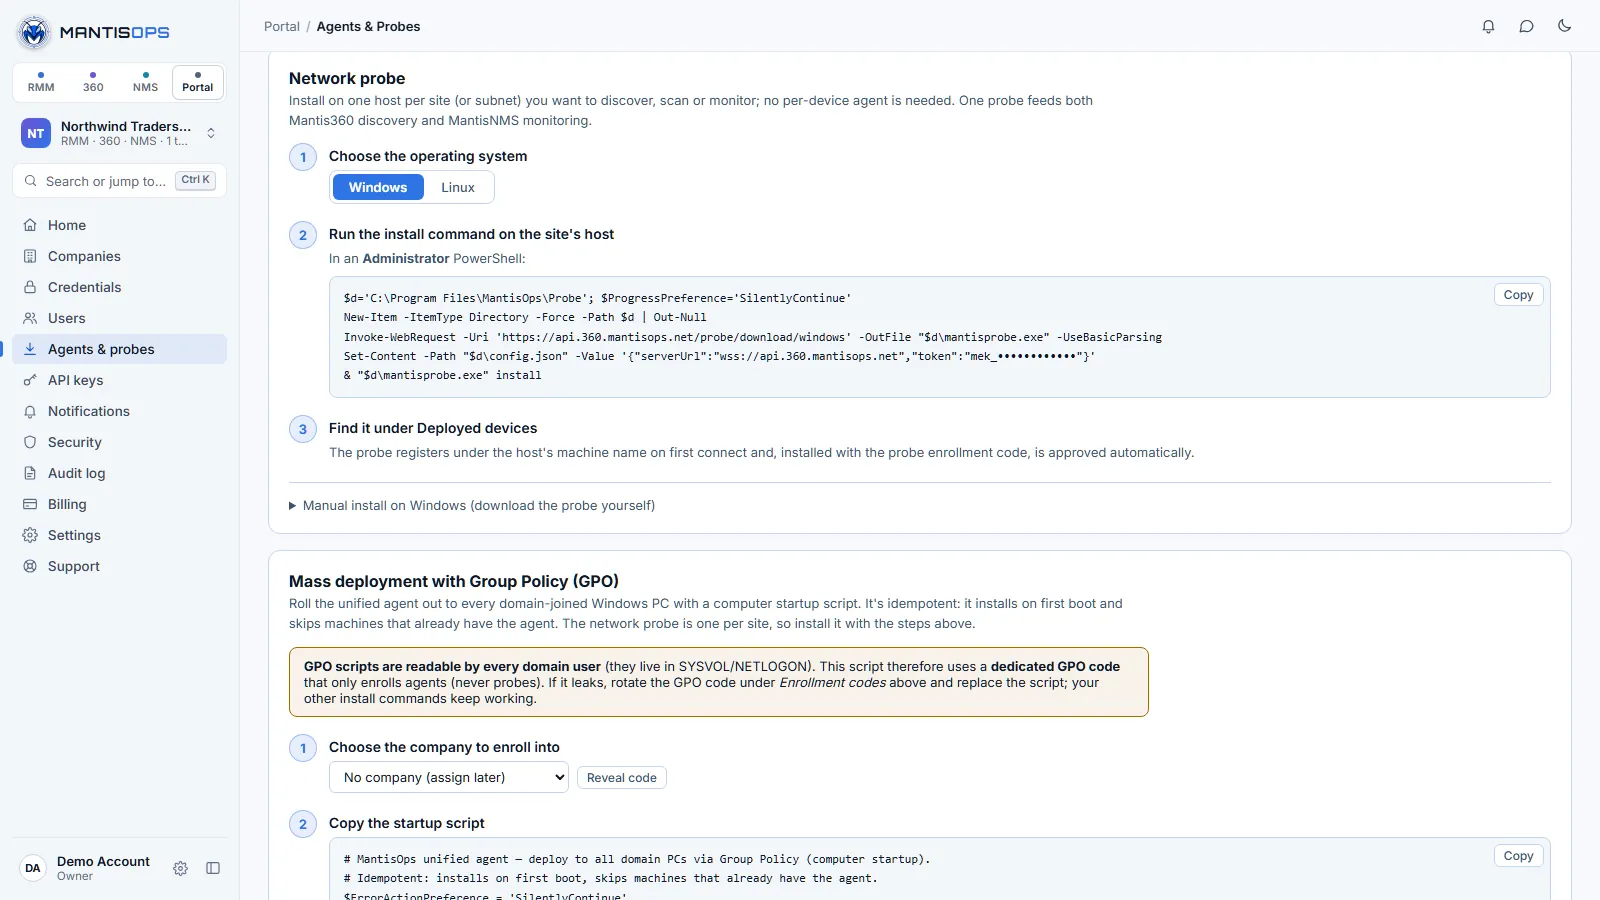
Windows installation
Run the command in an elevated PowerShell (with your probe code in place of the placeholder):
Installs as the Windows service MantisProbe and starts automatically. No driver is needed; if Npcap is already installed on the host, the probe uses it for faster SYN port scanning.
Linux installation
Run the Linux command from the Portal as root. It installs /usr/local/bin/mantis-probe and the systemd service mantis-probe, on amd64 and arm64:
config.json, approval, updates, reinstalling, uninstalling and troubleshooting are covered in Installing a Network Probe.Register the probe to your tenant
The probe enrolls with the config.json the install command writes: your server URL and your probe enrollment code. To script deployment across several sites, use the same command at each site. Copy the probe code from the Customer Portal (portal.mantisops.net) → Agents & Probes → Enrollment codes; admins and owners can see it. A probe installed with a code is approved automatically — it does not wait in the approval queue — and the same code covers MantisNMS monitoring and Mantis360 discovery.
config.json from its own directory (or the path in the MANTIS_CONFIG environment variable). It's the same probe as Mantis360's, with the same serverUrl (wss://api.360.mantisops.net); its MantisNMS monitoring traffic goes to api.nms.mantisops.net.Confirm enrollment
Within about 60 seconds the probe registers itself and appears under Probes with a green online indicator. A probe that registered with your tenant ID before October 1, 2026 and hasn't been approved yet shows Waiting for approval there until an admin approves it. Once it's online you're ready to discover devices.
Discover Devices
Discovery finds the devices on a segment so you can turn them into monitored sensors, rather than typing IPs by hand.
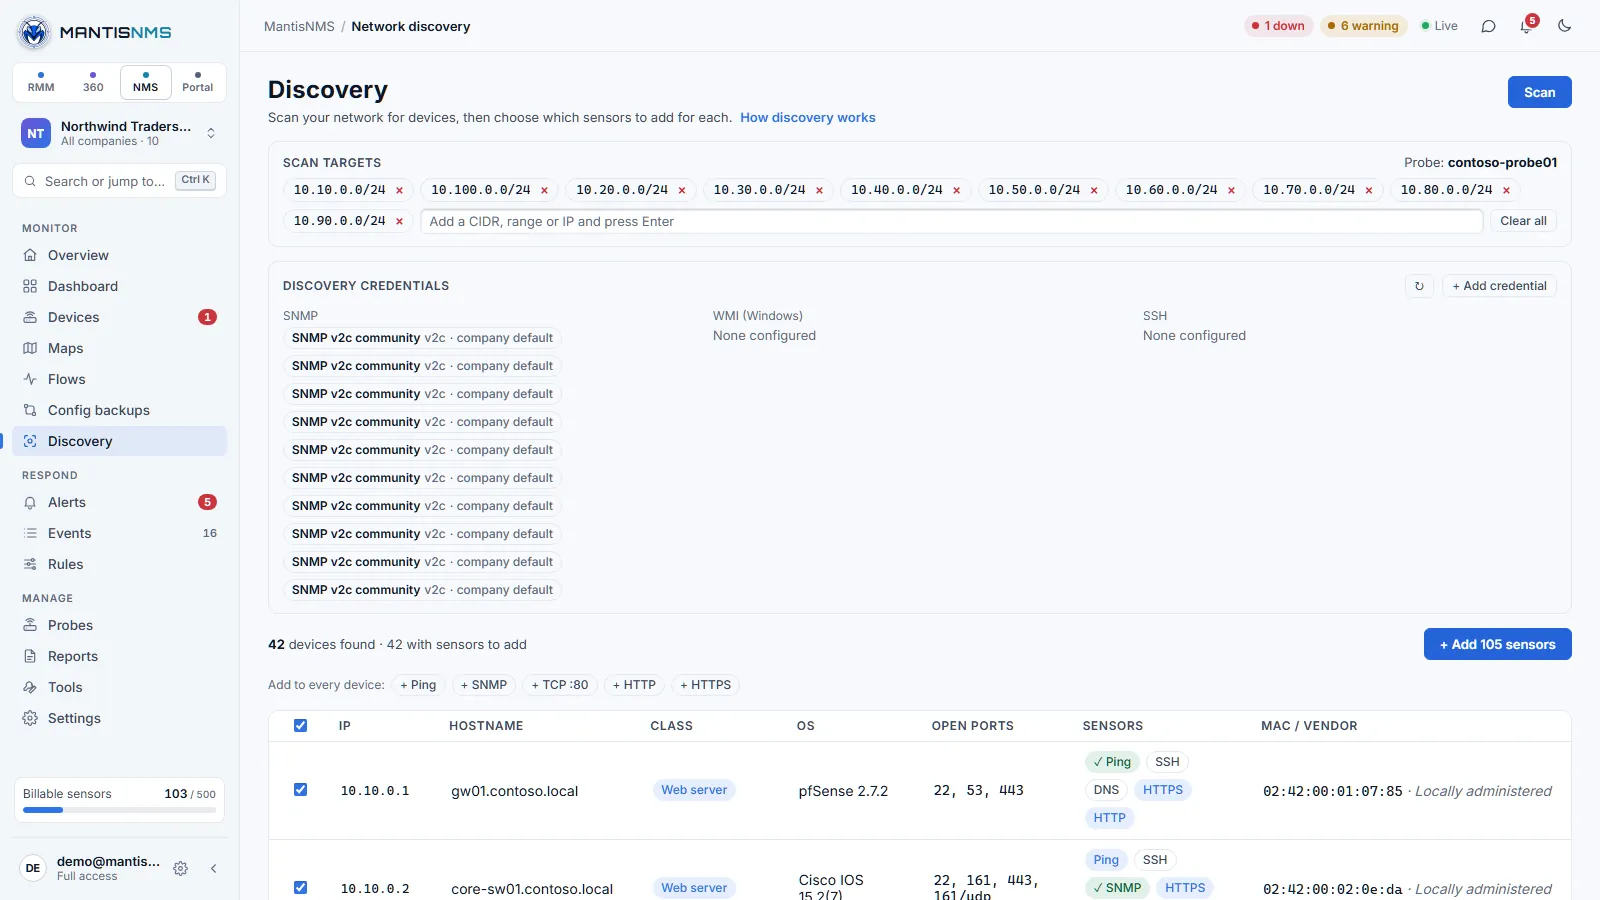
Run a discovery scan
- Pick the company or site in the client switcher, and check the probe in the top bar's probe picker (Auto uses an online probe for that company or site)
- Go to Monitor → Discovery. Scan targets are pre-filled from the selected company or site's subnets; add or remove subnets to sweep (e.g.
192.168.1.0/24) - Optionally supply SNMP credentials (v2c community or v3 USM) so discovered devices are identified by vendor/model
- Click Scan — devices stream into the table as they're found
Discovery uses ICMP + ARP host discovery, light port checks, and SNMP sysObjectID decoding to classify each device (switch, router, firewall, server, printer, UPS, and so on).
Credentials
SNMP and device credentials are stored in the central credential vault, encrypted at rest, and are only ever used by your probe to poll your own devices. Manage reusable named credentials in the Customer Portal → Credentials and assign them per device or per subnet.
Network Map
Monitor → Maps opens on the Network tab: a live topology map of your sites, the devices in them and the links between them, coloured by health. Anyone who can view devices can open it. The other tabs are Map Designer, Net Map (discover) and Geo Map; Map Designer and Net Map need the Network tools permission.
Fill the map with a Net Map scan
MantisNMS draws the map from your probes' Net Map scans. Until one has run, the map shows No network map yet.
- Go to Maps → Net Map (discover) (or Tools → Net Map)
- Enter a Seed device (SNMP) — usually the site's core switch — and choose the SNMP credential (or Use site default) and the site's Probe
- Click Scan. The scan reads LLDP/CDP neighbours and switch bridge tables (MAC address collection is always on for scans started in MantisNMS)
- Repeat at each site. The map picks up a finished scan straight away, or within the hour; Refresh rebuilds it on demand (Network tools permission)
SNMP sensors on your firewalls and switches add health and link utilisation to the map.
Using the map
- Find device or IP (press
/), Group by: Site or Company, and the Utilisation and Only problems toggles are in the toolbar. Healthy sites collapse so problems stand out; click one to expand it. - Click a device to open its side panel without leaving the map: Health · last 24 h (CPU, memory, response time, availability), its busiest interfaces and neighbours, its latest config backup and changes (with Back up now), and the endpoints connected to it: managed MantisRMM devices and unmanaged MAC addresses read from the switch's bridge table. Open device takes you to the full device page.
Sensors
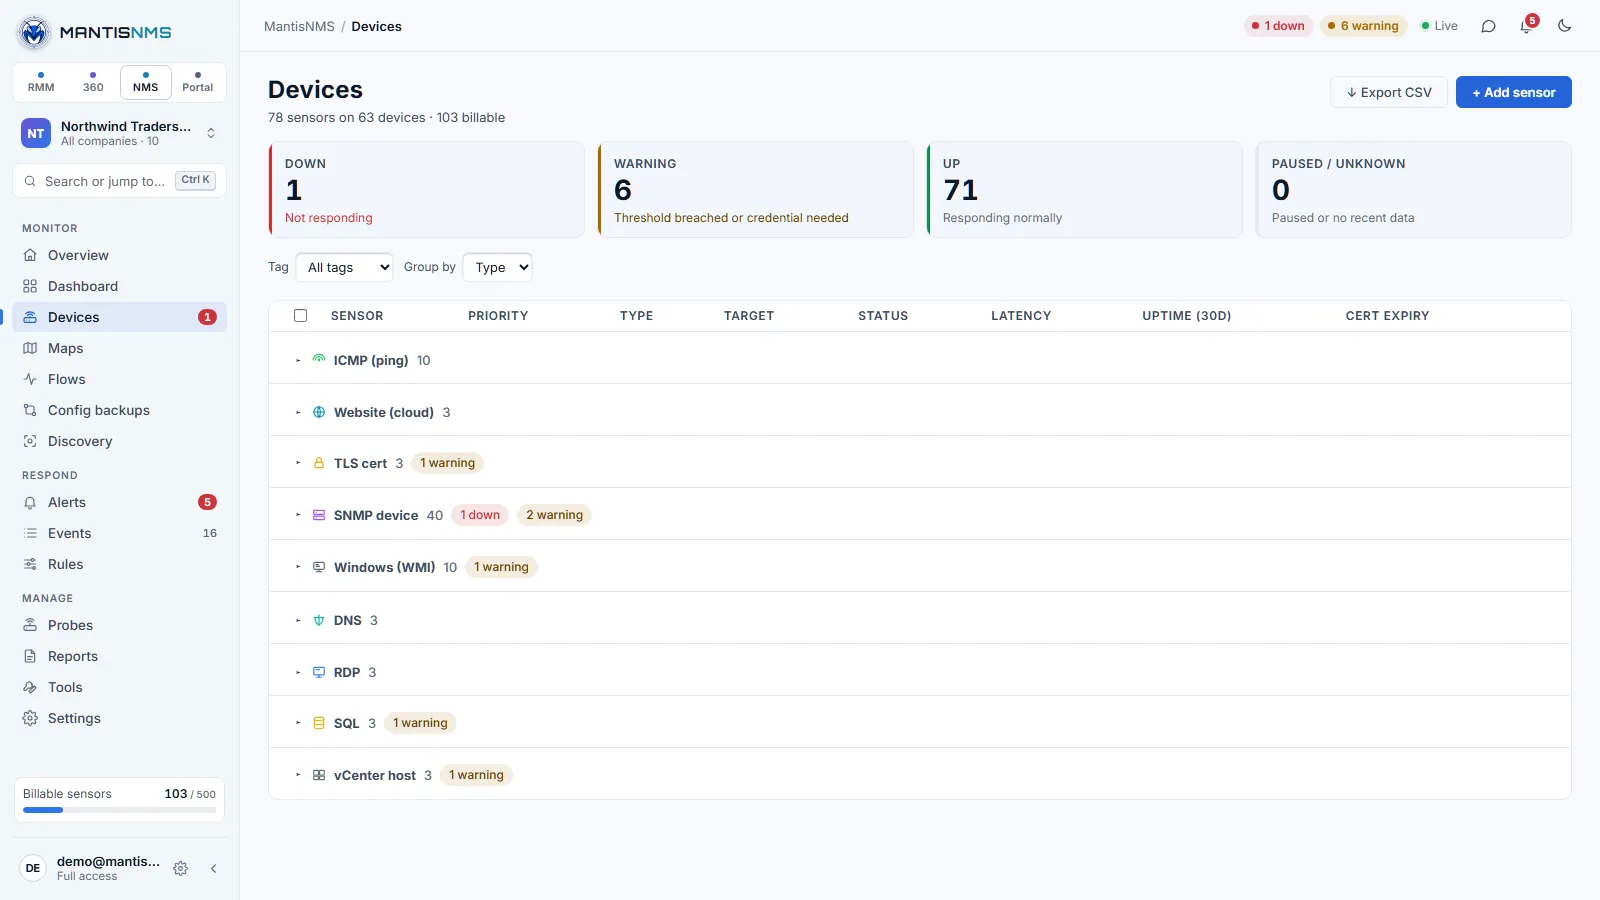
A sensor is a single thing MantisNMS watches. Add sensors from Monitor → Devices → + Add sensor (or Add a sensor in Ctrl K search), or add sensors for a discovered device from its Discovery results.
Sensor types
| Type | What it monitors |
|---|---|
| SNMP device | A switch/router/server polled via SNMP. Its billable sensors are its selected interfaces + host aspects (below). The device itself is a free container. |
| Ping (ICMP) | Reachability and round-trip latency to any host. |
| HTTP(S) | URL availability, response time, status code, and TLS certificate expiry. |
| TCP port | Whether a TCP service (e.g. 22, 443, 3389) accepts connections, and how fast. |
| SSH | Reachability plus optional command-based checks on Linux/network hosts. |
Polling interval
Each sensor has its own interval (default 60s; ICMP may go as low as 30s). Set it on the sensor when you create or edit it. The interval controls how often the sensor is checked — it does not change what a sensor costs.
Interface Monitoring
For an SNMP switch or router, MantisNMS discovers every interface — but you choose which ones are worth monitoring. Each monitored interface is one sensor, tracking bandwidth in/out and up/down availability.
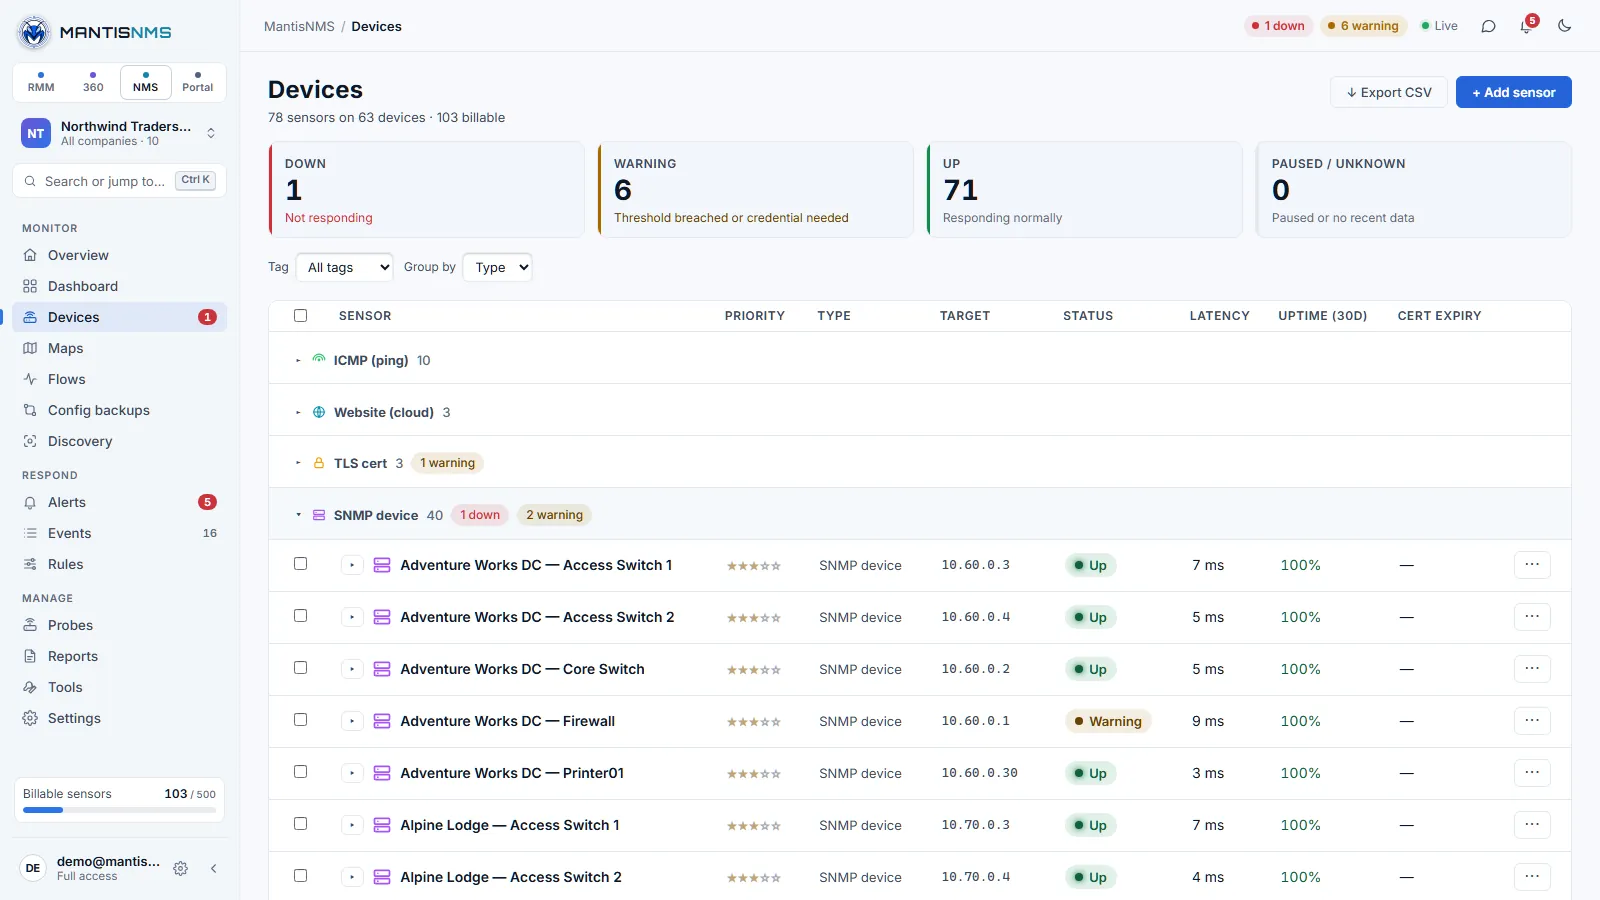
Select interfaces to monitor
- Open the SNMP device in Devices and go to its Interfaces panel
- MantisNMS pre-selects the connected (operationally up) interfaces as a suggested set; the Monitor: All / Connected / None shortcuts change the whole selection
- Tick or untick interfaces in the Mon. column — deselect unused access ports, admin-down ports, and stack links
- Click Save monitoring. Only the selected interfaces are billed and stored going forward
Interface availability & alerting
A monitored interface that goes down opens an incident (with a one-poll flap damp so a brief blip doesn't alert) and sends a notification through your alert channels; recovery closes the incident and sends an "up" notice. Availability is reconstructed from up/down transitions, so a stable port costs almost nothing to track.
Host Sensors
When a monitored device reports host resources over SNMP (or via a MantisRMM/native agent), each resource becomes its own sensor, the same way a dedicated monitoring tool counts them:
- System Uptime — one per monitored host
- CPU Load — when the device exposes it
- Memory — when the device exposes it
- Disk — one sensor per fixed disk/volume
Open a device's Host sensors · billing panel to see the aspects it exposes and pause any you don't want to monitor or bill (for example, a noisy temp volume). Paused aspects stop counting immediately.
Alerts & Incidents
An incident opens when a sensor fails its check for the configured number of polls and closes when it recovers. Incidents appear under Respond → Alerts (tabs Active, Acknowledged and History), in the bell in the top bar, on the Network overview and in dashboard widgets.
Configure notifications
- Go to Manage → Settings → Notifications (the Alert notifications card)
- Set the Notification email and any additional channels: Slack, Microsoft Teams, a generic webhook, PagerDuty, Opsgenie or SMS
- Under Alert after, choose how many consecutive failed checks trigger an alert (default 2), and optionally Escalate if still down after a delay
Thresholds
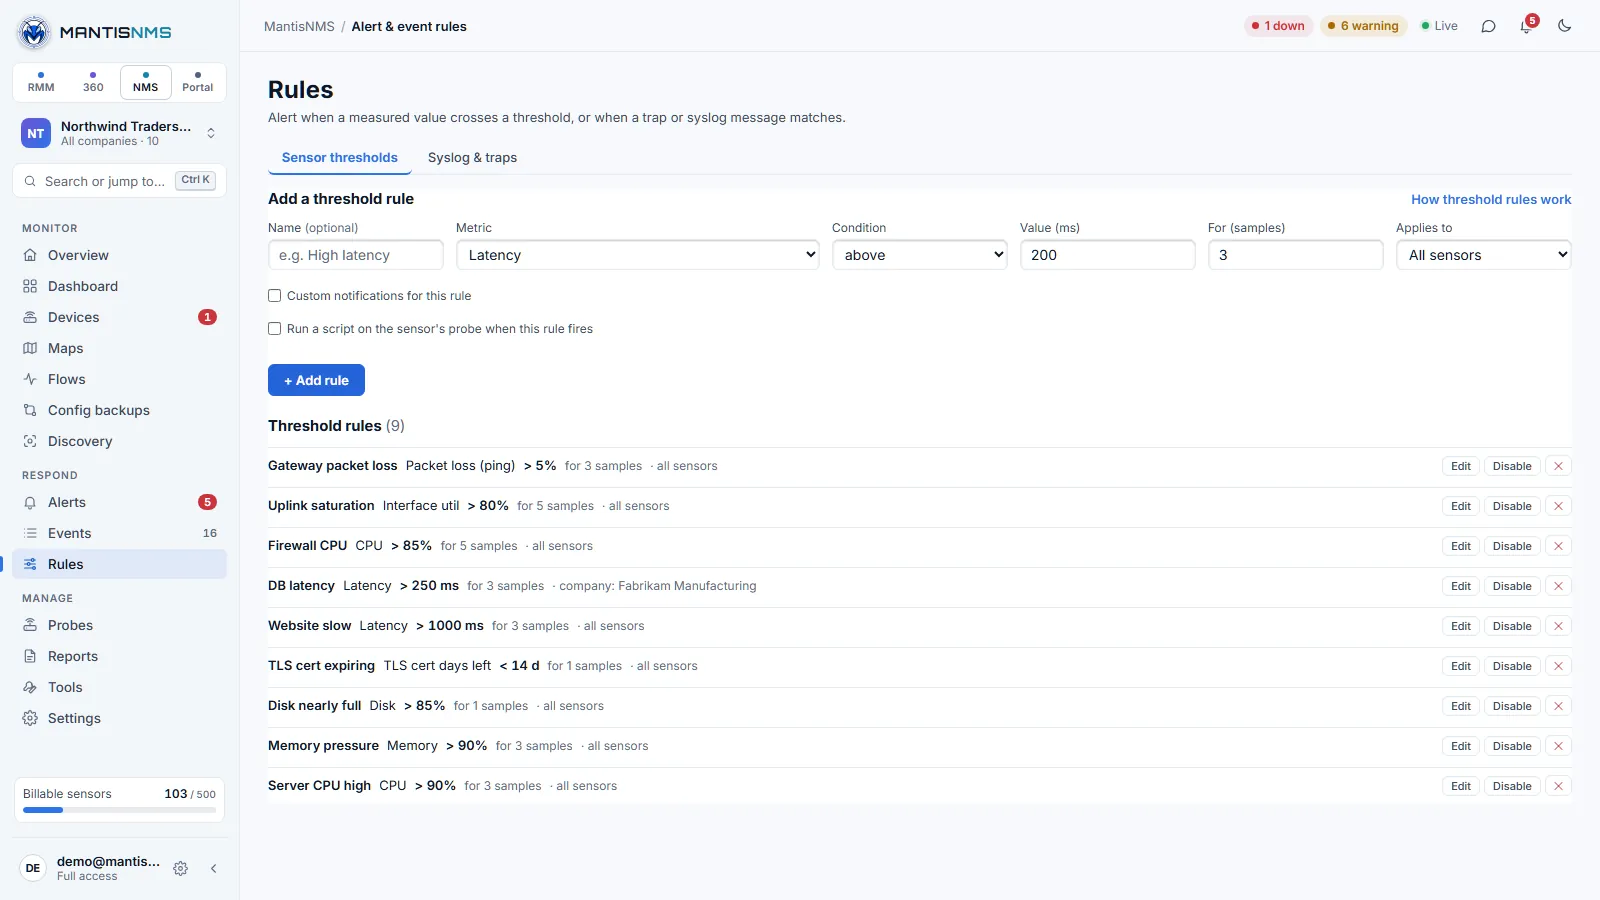
Beyond up/down, you can raise incidents on metric thresholds — e.g. latency, interface utilization or errors, CPU/memory/disk — under Respond → Rules → Sensor thresholds. A rule can target one sensor or every sensor of a kind (tenant-wide).
Syslog & SNMP Traps
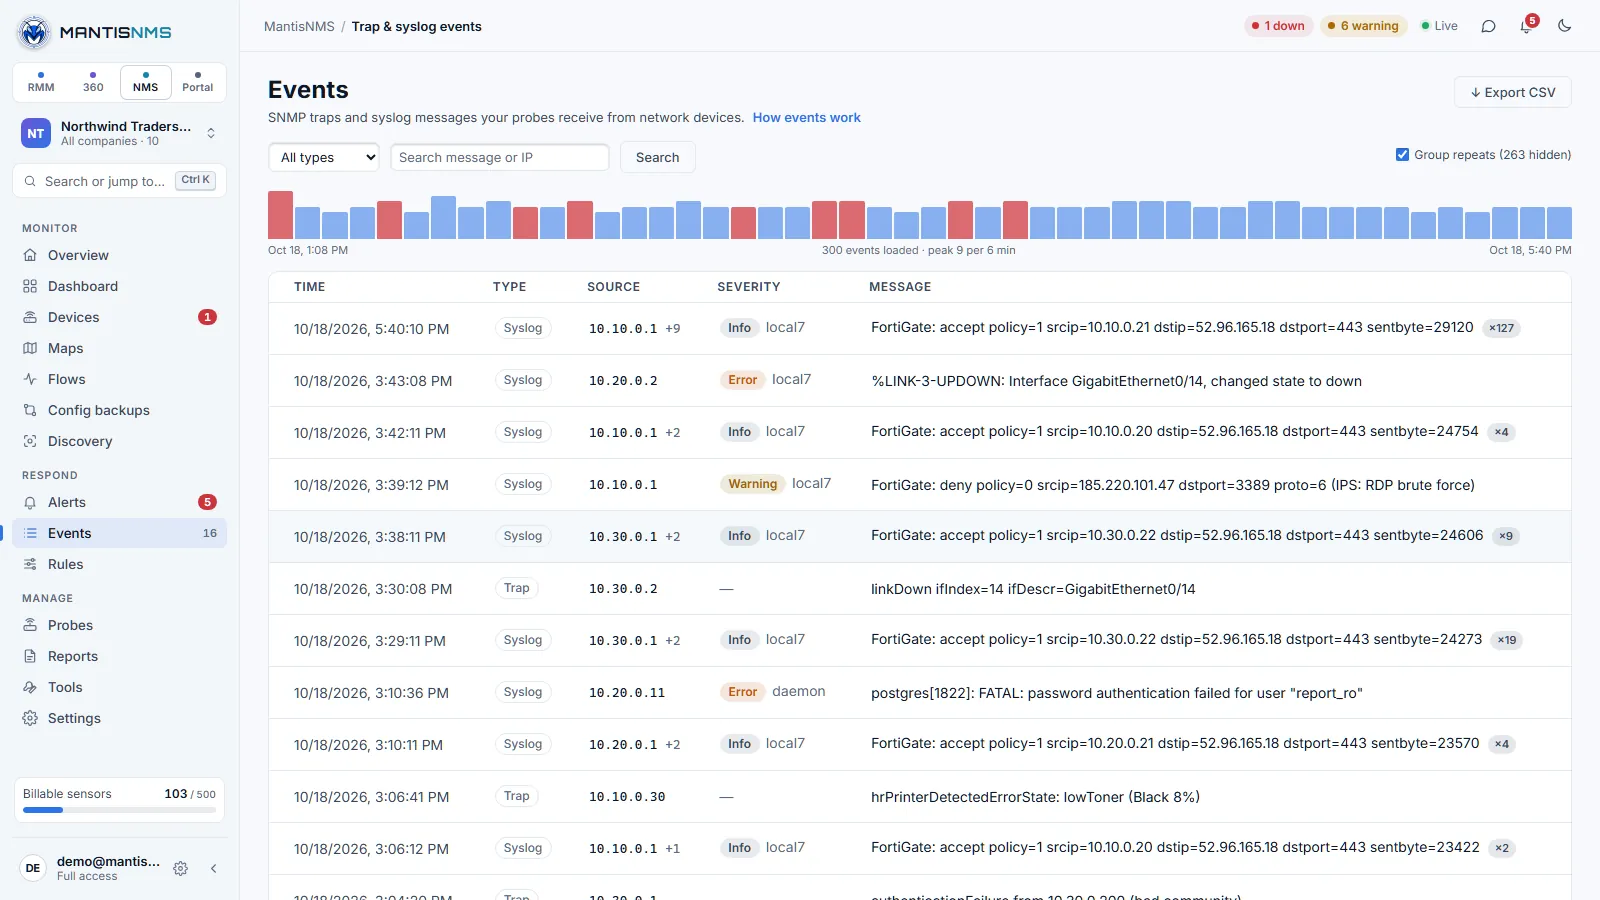
Point your devices' syslog and SNMP-trap destinations at the probe, and MantisNMS ingests the messages for search and audit. They appear under Respond → Events, filterable by kind, source, severity, and message, with CSV export for SIEM hand-off.
Flow Monitoring
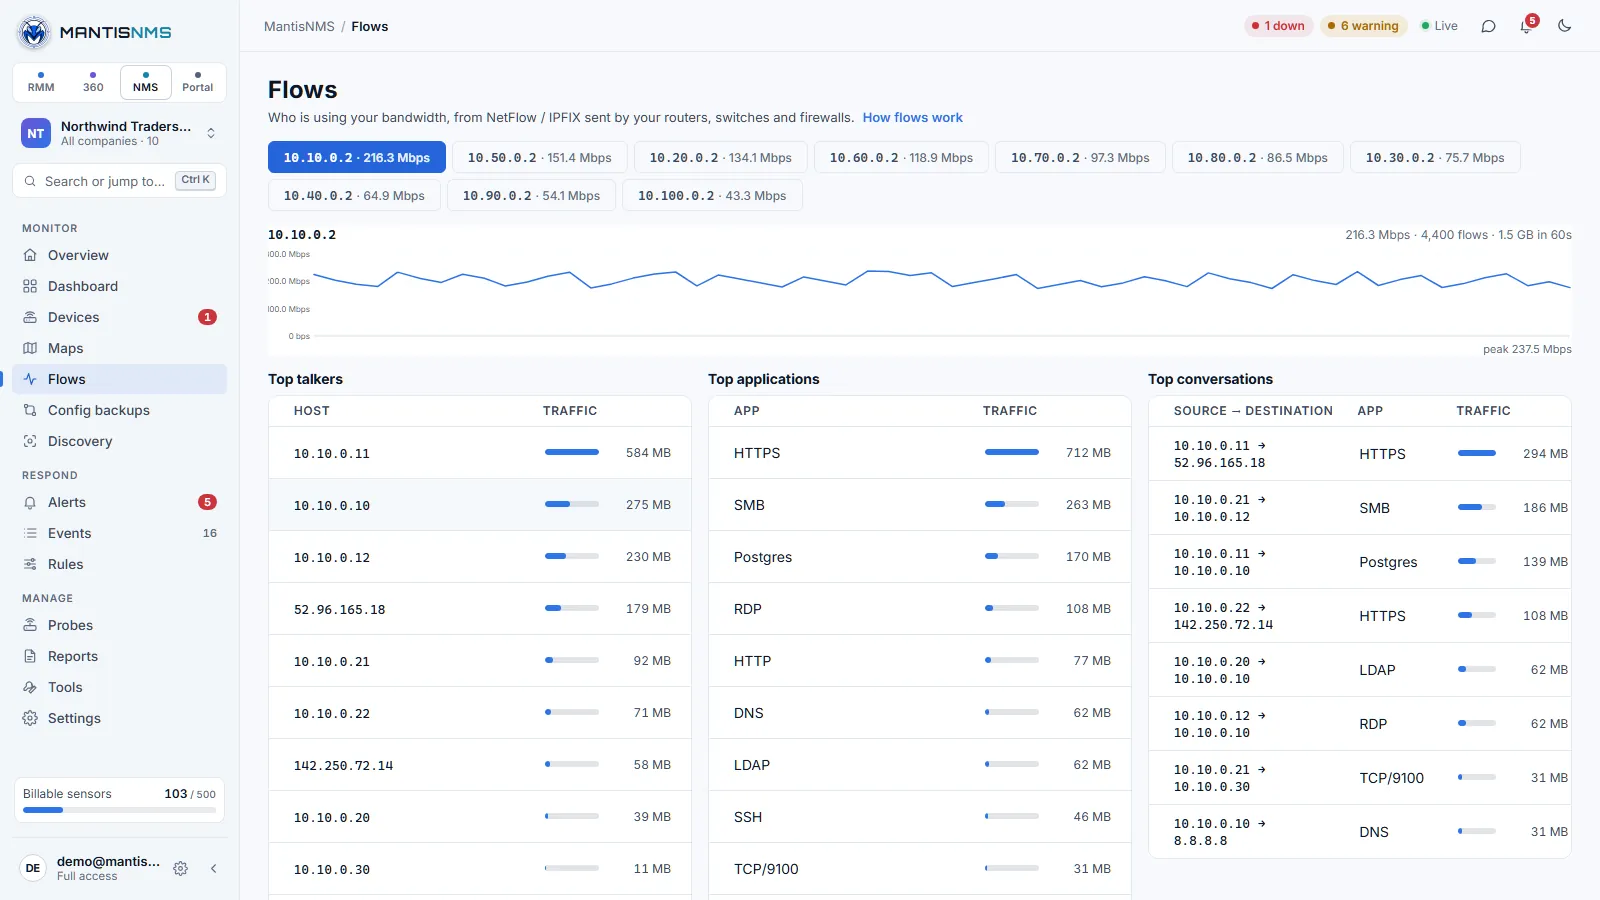
MantisNMS includes a passive flow probe for NetFlow v5/v9, IPFIX, and sFlow. Configure your routers/switches to export flow records to the probe, and MantisNMS aggregates them per exporter into ranked top talkers, top conversations, and top applications over a reporting window, under Monitor → Flows.
| Protocol | Default export port |
|---|---|
| NetFlow v5 / v9 | 2055/udp |
| IPFIX | 4739/udp |
| sFlow | 6343/udp |
Network Overview
Overview is the first page MantisNMS opens on. It answers "is the network OK, and if not, what's wrong?" for the client you've picked in the client switcher:
- Headline — how many sites are healthy and the most important open problem, for example a device that has been down for two hours and is taking other devices with it, or an internet link that has been saturated. Show on map and Open alerts take you straight to it.
- Tiles — Devices up, Sensors OK, WAN latency (the median of your ping sensors to public IPs; add one if the tile asks), and Config changes in the last 24 hours.
- Device health honeycomb — every hexagon is a device, grouped by site, company or type, with groups that have problems first. Healthy devices stay quiet on purpose: colour is for things that need you. Devices are placed in a site by the site's subnets, then by their probe's site.
- Open incidents — related alerts are grouped into one incident with its root cause: an offline probe, a down device that takes the devices behind it down too (this uses the links a Net Map scan finds), a port down, a saturated WAN link, link errors, or a failing check. Each incident shows how many alerts it groups and whether it's acknowledged.
- Where traffic goes and Top talkers — a site → application → destination diagram and the busiest hosts and apps, for the last 1h, 24h or 7d. These need a router, firewall or switch exporting NetFlow (v5/v9) or IPFIX to one of your probes on UDP 2055 or 4739 (see Flow Monitoring); the overview rolls the flows up hourly.
The Dashboard page is still there for your own widget layouts.
Tags & Organization
Tag sensors to organize and filter them — by site, role, criticality, customer, or anything else. Tag filters drive the Sensors list, dashboards, and CSV exports, and tag-based rules can shape alerting. Use tags rather than rigid groups so a sensor can belong to several views at once.
How Sensors Are Counted
MantisNMS bills per sensor, following the "device = free container" model. Your billable count is the sum of:
- Each monitored interface on an SNMP device — 1 sensor
- Each reported host aspect (Uptime / CPU / Memory / each disk) that you haven't paused — 1 sensor
- Each leaf monitor (ping, HTTP, TCP, SSH) — 1 sensor
An SNMP device counts as zero on its own — you only pay for the interfaces and resources you actually choose to watch. The Billable sensors meter in the sidebar shows your current usage against your plan. Click it for the breakdown: sensors by type, billable sub-sensors (SNMP interfaces, monitored VMs and host aspects), the total, and how many remain on your plan. See pricing for current per-sensor tiers.
Submit a support ticket via our support page or email support@mantisops.net. We respond within one business day.